
Government / Infrastructure
Special economic zone quarterly program visibility
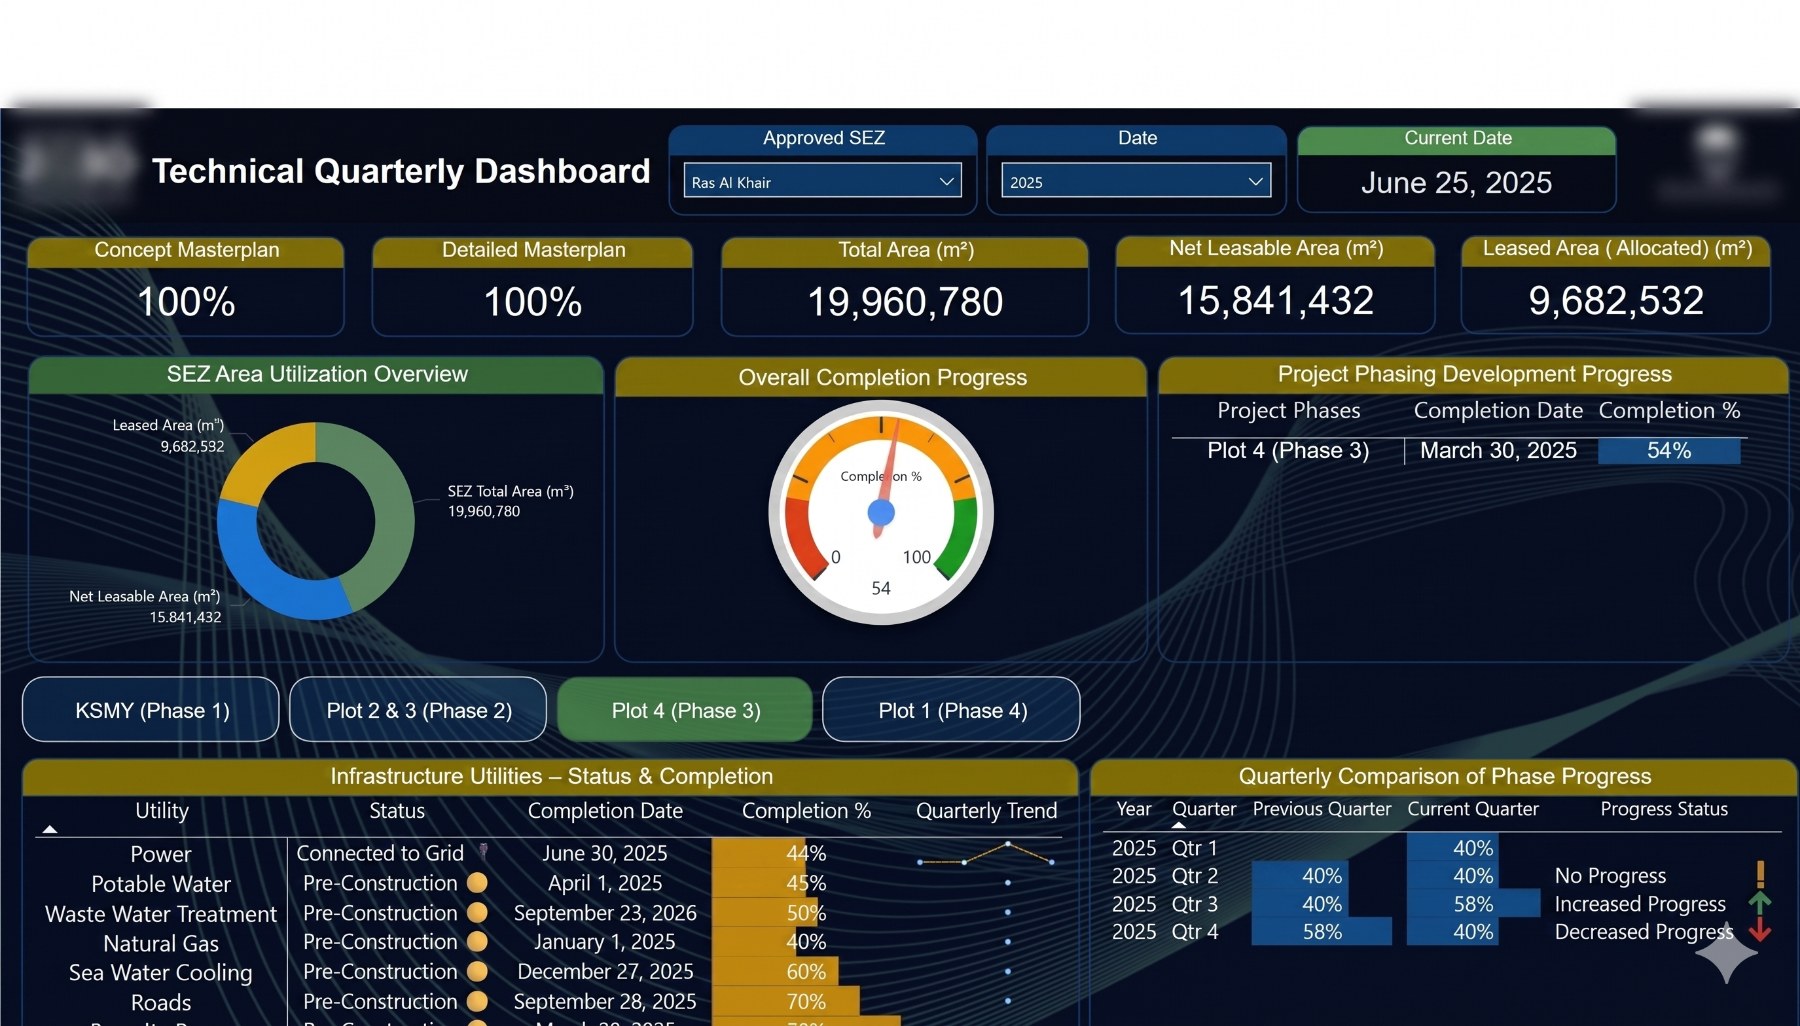
A quarterly decision view across masterplan area, leasing, allocation, and utility-readiness indicators for multiple economic-zone cities.
Challenge
What needed to change
Planning, investor, and utility updates were spread across separate trackers, making quarter-ready leadership reporting difficult.
Delivery
What was built
A Power BI Technical Quarterly Dashboard with masterplan, leasing, utilization, utility-readiness, city, and year views.
Evidence
What the supplied material supports
- 19.96M sqm represented in the reporting scope
- Milestone status visible in one quarterly view
- Quarter-over-quarter comparison for leadership review
Evidence note: 100% milestone visibility means the tracked milestones were represented in the dashboard; it does not mean every milestone was completed.
Back to portfolio