
Finance / FP&A
Financial performance and actual-versus-forecast reporting
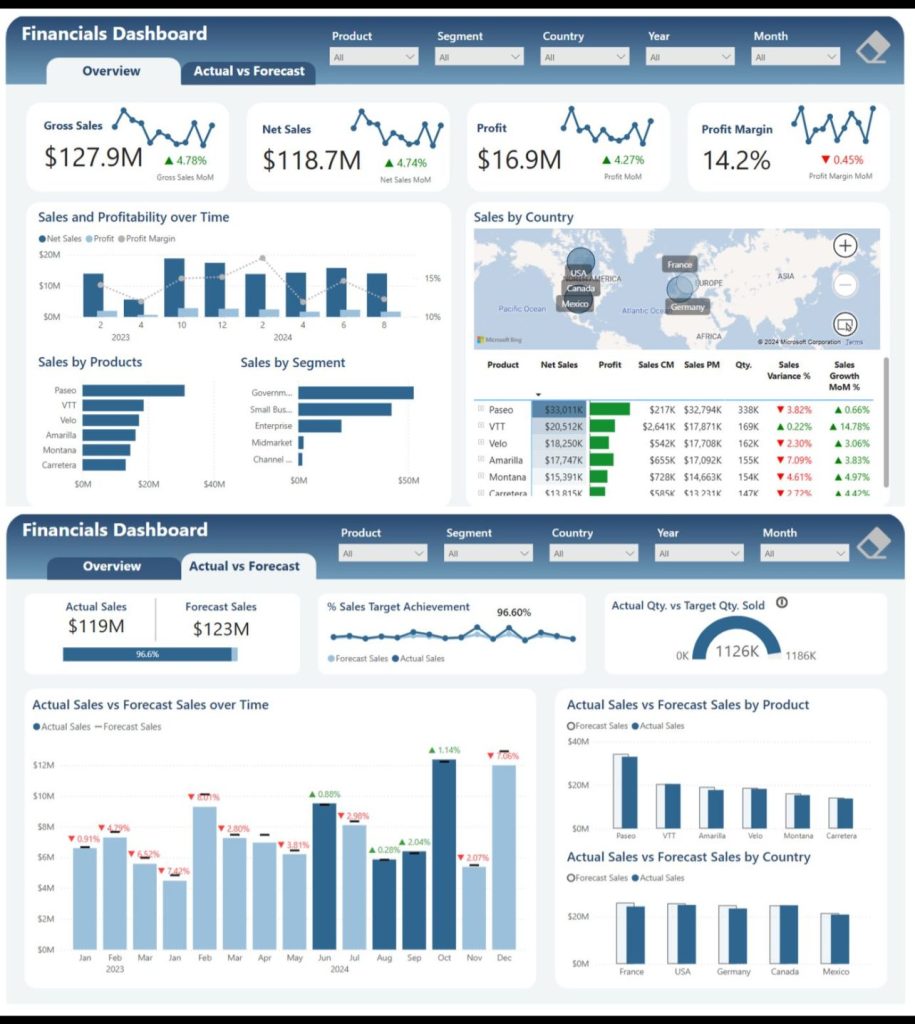
A two-view financial dashboard connecting executive KPIs with actual-versus-forecast analysis across product, segment, country, year, and month.
Challenge
What needed to change
Gross sales, net sales, profit, margin, and forecast tracking were split across reports, slowing monthly review and variance analysis.
Delivery
What was built
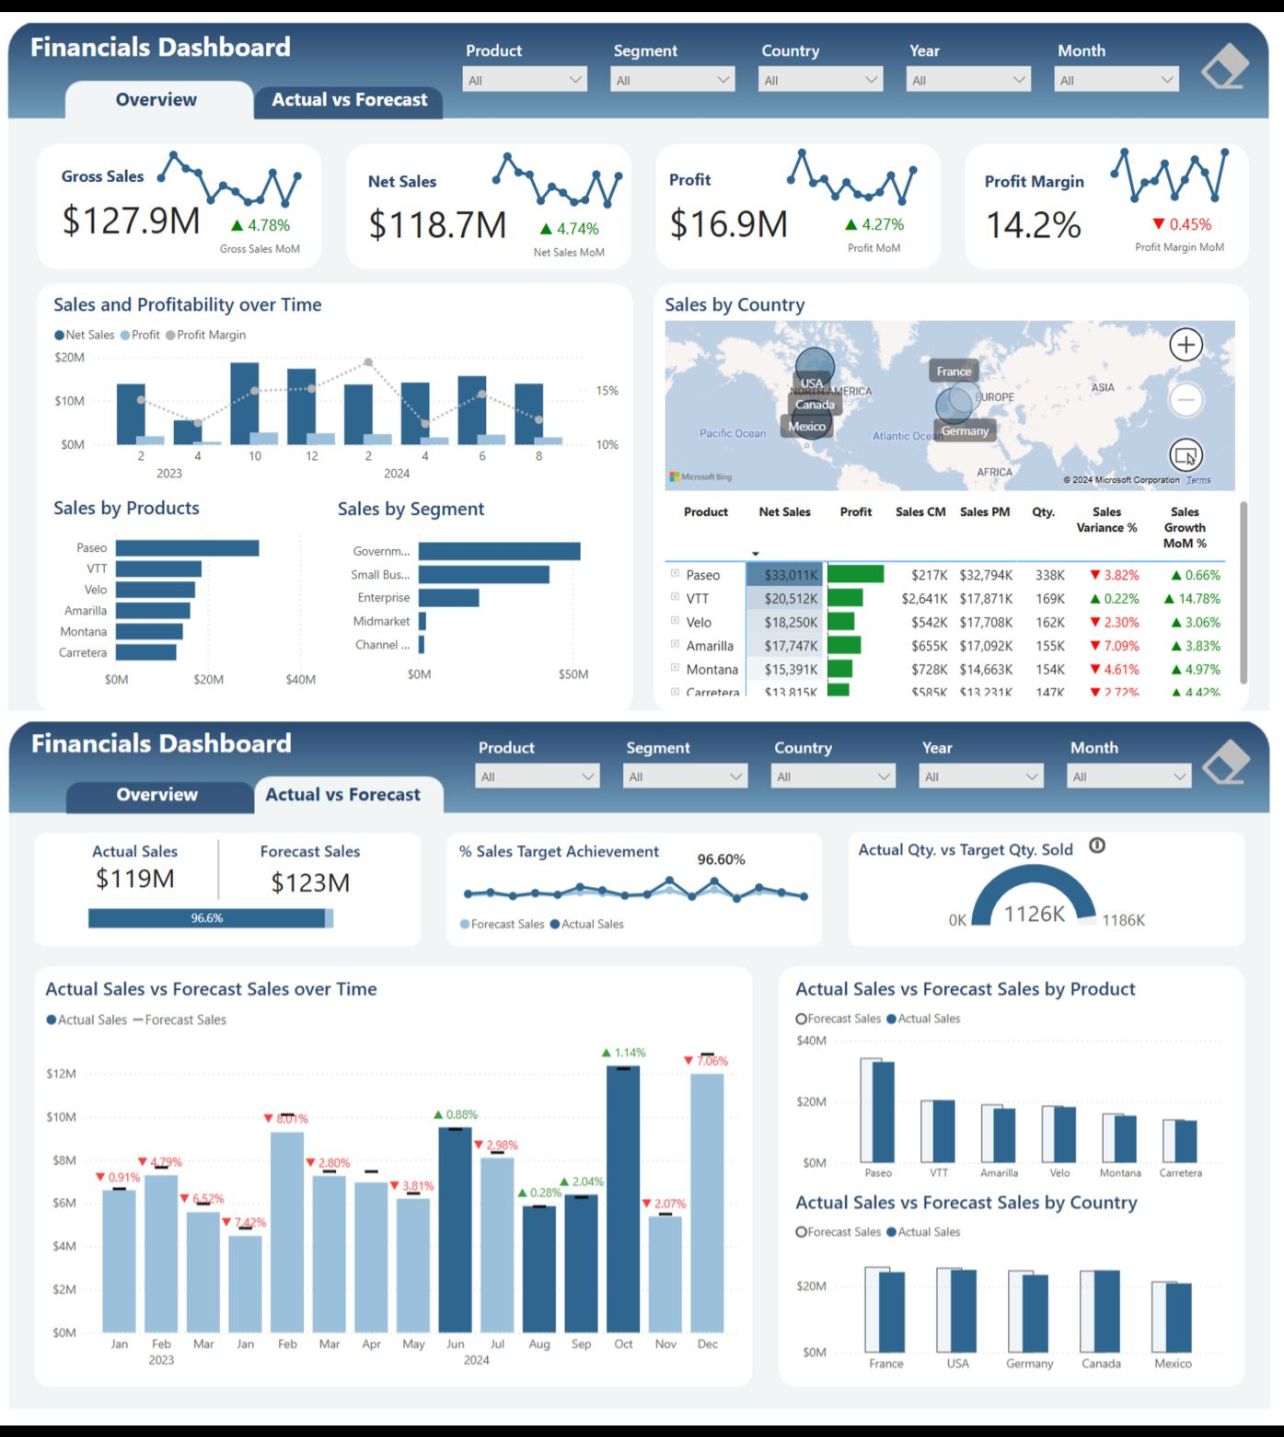
One connected dashboard with an Overview view and a clearly separated Actual vs Forecast view. The original vertical evidence image is preserved in full rather than cropped.
Evidence
What the supplied material supports
- Overview: sales, profit, and margin KPIs
- Actual vs Forecast: target achievement and variance
- Filters across product, segment, country, year, and month
Evidence note: The two vertically stacked views are labeled in copy so their provenance remains clear.
Back to portfolio